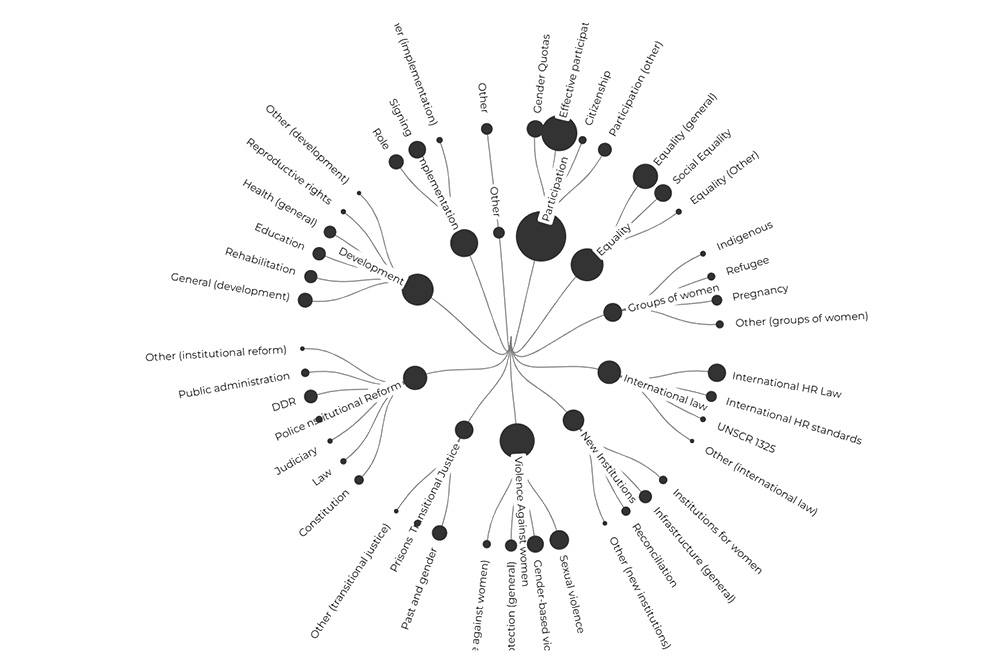
Visualise how and to what extent women, girls, and gender are taken into consideration in peace agreements around the world.
Rethinking peace & transition processes in a changing conflict landscape
Seminars, discussions and more from PeaceRep consortium members.
Explore our visualisations to better understand data trends
Explore our data visually to better understand data trends and insights. Click below to browse our range of visualisations. You can also browse our visualisations on the PA-X Analytics website
Visualise how and to what extent women, girls, and gender are taken into consideration in peace agreements around the world.

Deep dive into Russia and China's role as third parties to peace agreements in these visual scrollytelling interfaces.

Explore actors' roles as signatories to peace agreements in these interactive actor-agreement networks.

Explore the contrast between an ideal peace process and the messy reality, as our data captures the stages of agreements signed.

Explore and compare how different peace agreements in case countries unfold over time.

Conflict events & peace and transition documents in Yemen through connected national and local peace initiatives from 1990 onwards, in Arabic /عربى or in English.

